Cuttlefish Hunting Behavior: Supplemental Materials
Supplemental materials included in the paper “An experimental method for evoking and characterizing dynamic color patterning of cuttlefish during prey capture” (in prep):
Supplemental Text
Movement phases of the robotic prey:
- Natural: Skewer arm rotates clockwise into the water until it is fully submerged and approximately perpendicular to the surface of the water (“90 deg down”), pauses, then “wiggles” 3 times. A single “wiggle” consists of moving 10 deg clockwise (CW), then 10 deg counter-clockwise (CCW), then 10 deg CW again; or 10 deg CCW, then 10 deg CW, then 10 deg CCW again. In between each wiggle, the skewer arm paused for 3 seconds. After 3 wiggles, the skewer arm is moved back out of the water to the “start position.”
- Smooth: Skewer arm enters the water and travels smoothly through one full rotation back up to the start position. Each food offering alternates between CW and CCW rotations.
- Predictable: Skewer arm begins to enter the water along a smooth CW or CCW rotation. If the skewer reaches “90 deg down” and pauses, the skewer exits the water back in the direction from which it came. If the skewer enters the water and does not pause, the skewer continues in the same direction to exit the water. The “robotic prey” was designed to randomly choose whether or not to pause during each trial of this stage.
Supplemental Figures
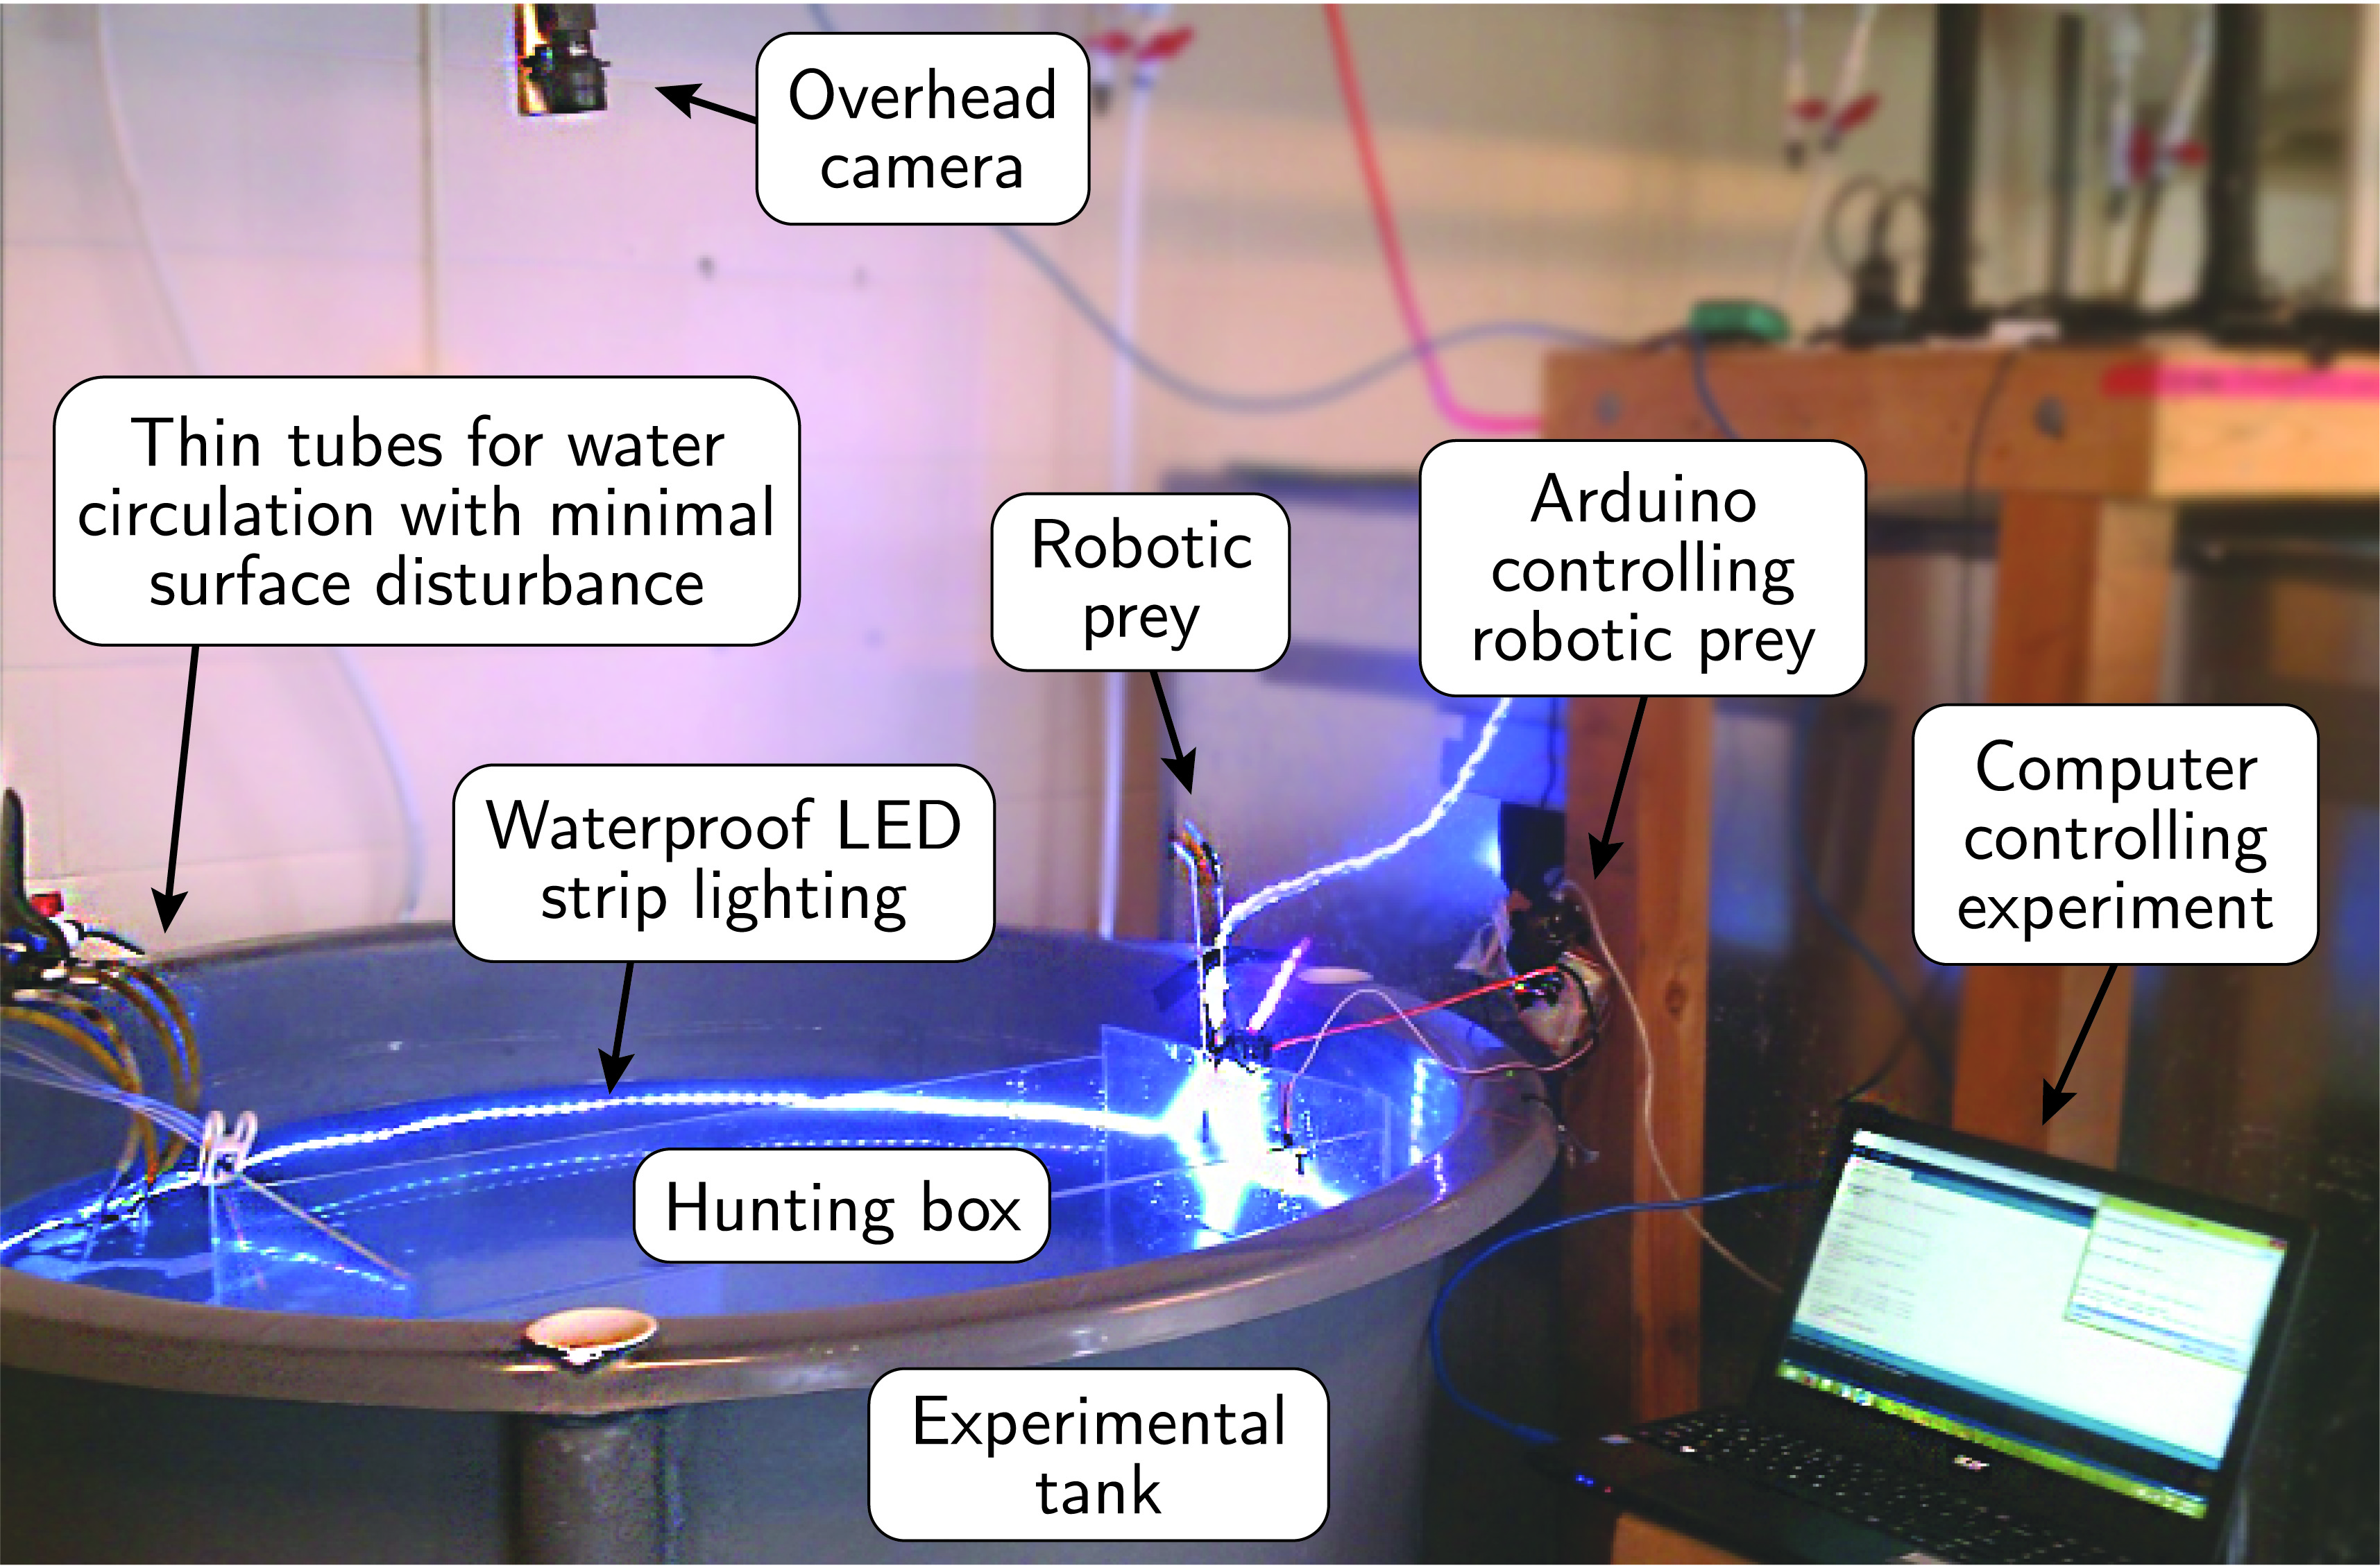
Figure S1: The experimental tank. The hunting box, with hardware setup controlling the robotic prey, inside the circular holding tank with LED lighting inside the holding tank and overhead Point Grey FlyCap2 camera.
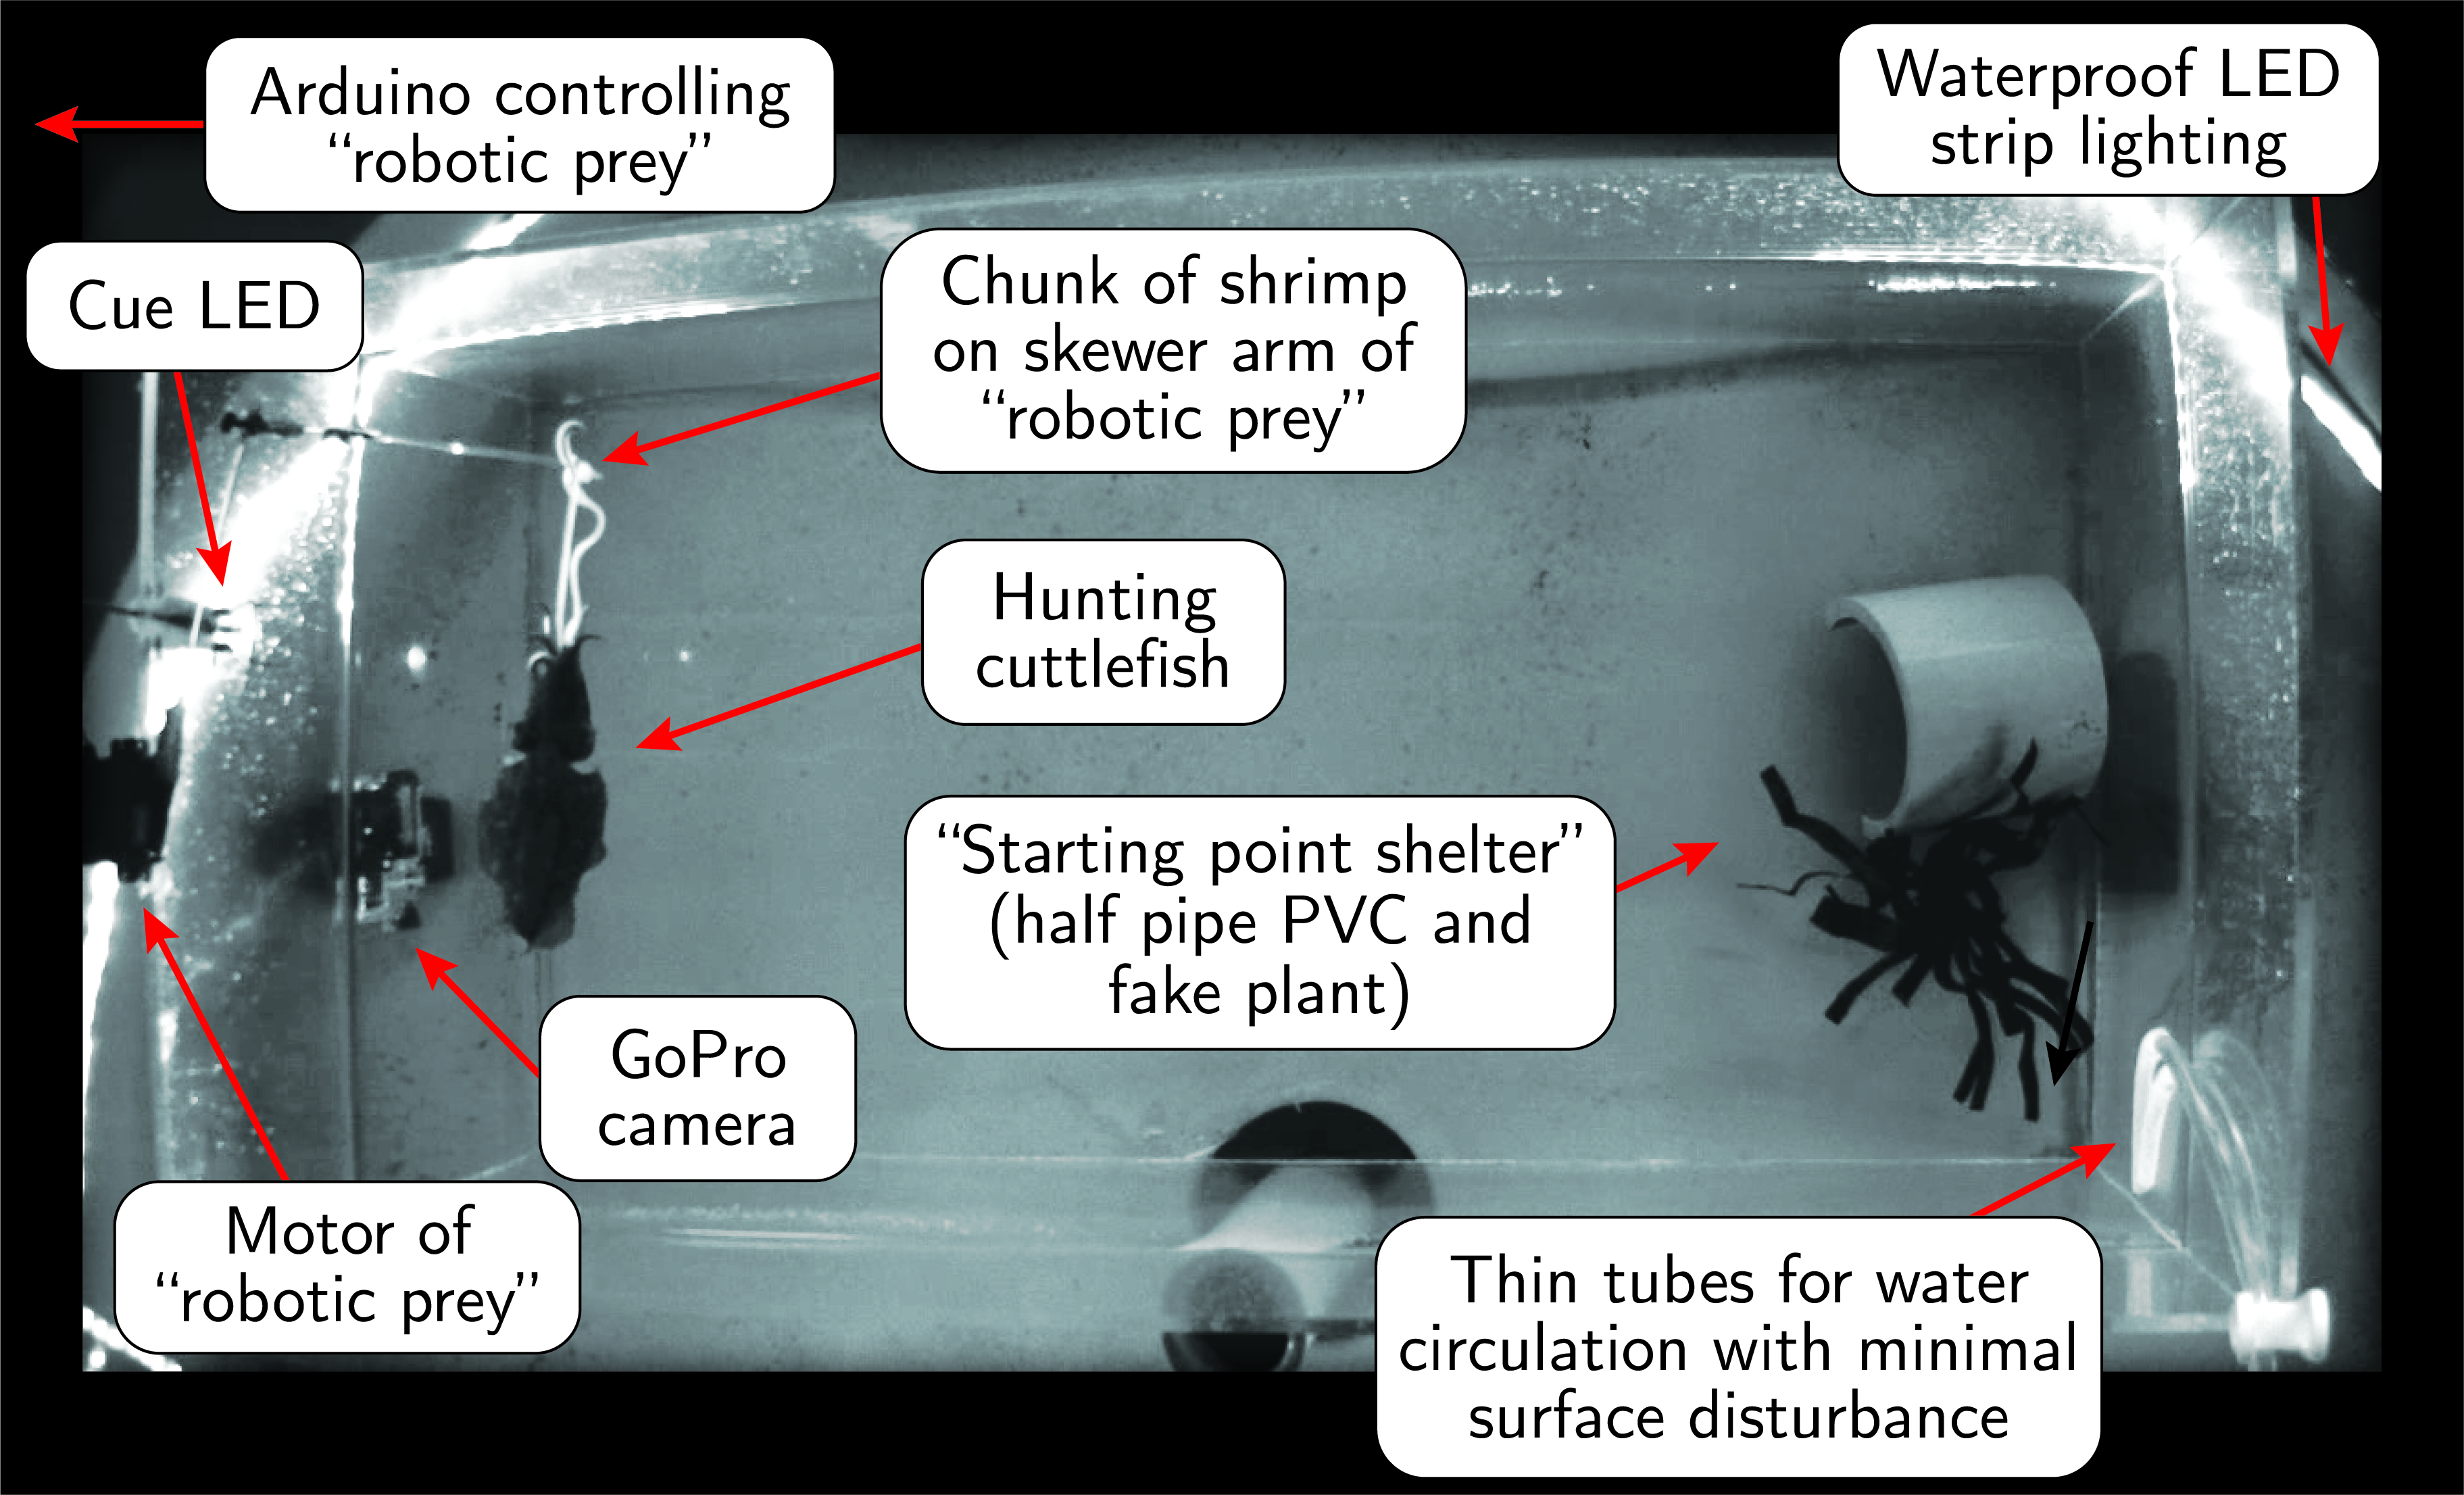
Figure S2: Overhead view of hunting box inside the holding tank. This image is a screenshot from a session video recorded by the overhead Point Grey FlyCap2 camera.
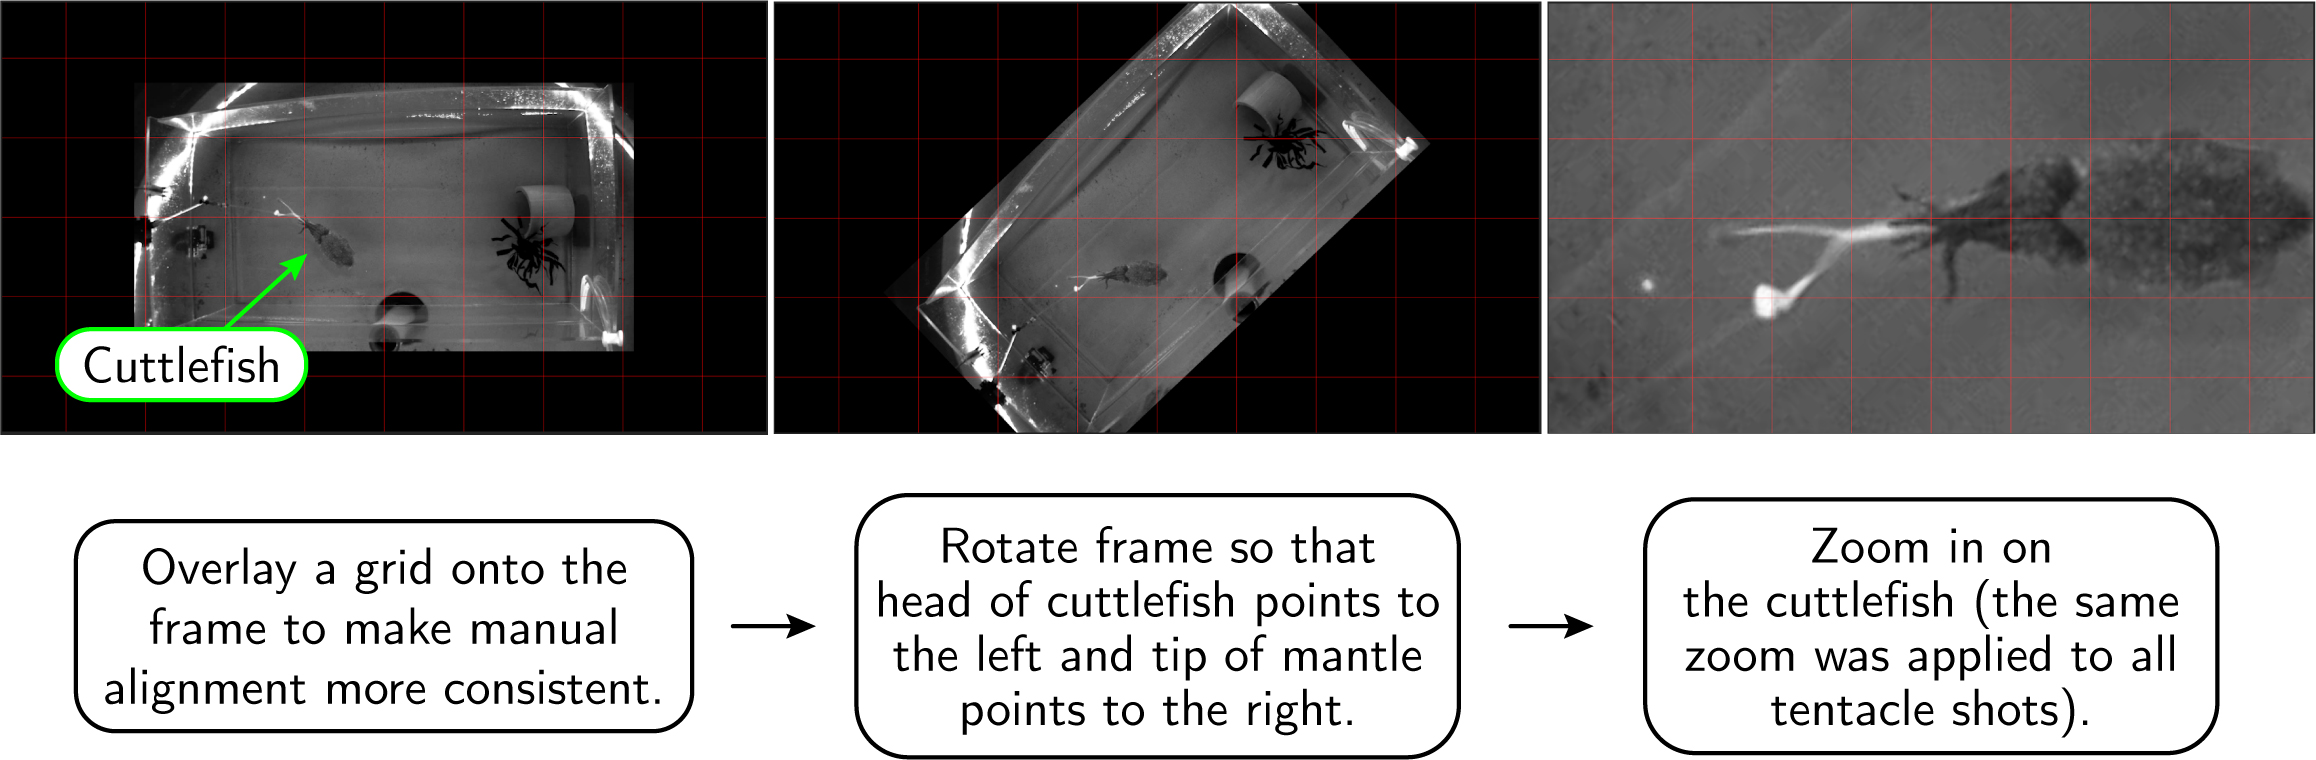
Figure S3: TGB Videos, spatial alignment. Example of the process of cropping and aligning a single frame of a Cuttle Shuttle hunting session video recording. Manual alignment of all ‘TGB videos’ was done using Apple software Final Cut Pro and Adobe Premiere Pro by D. Kim.
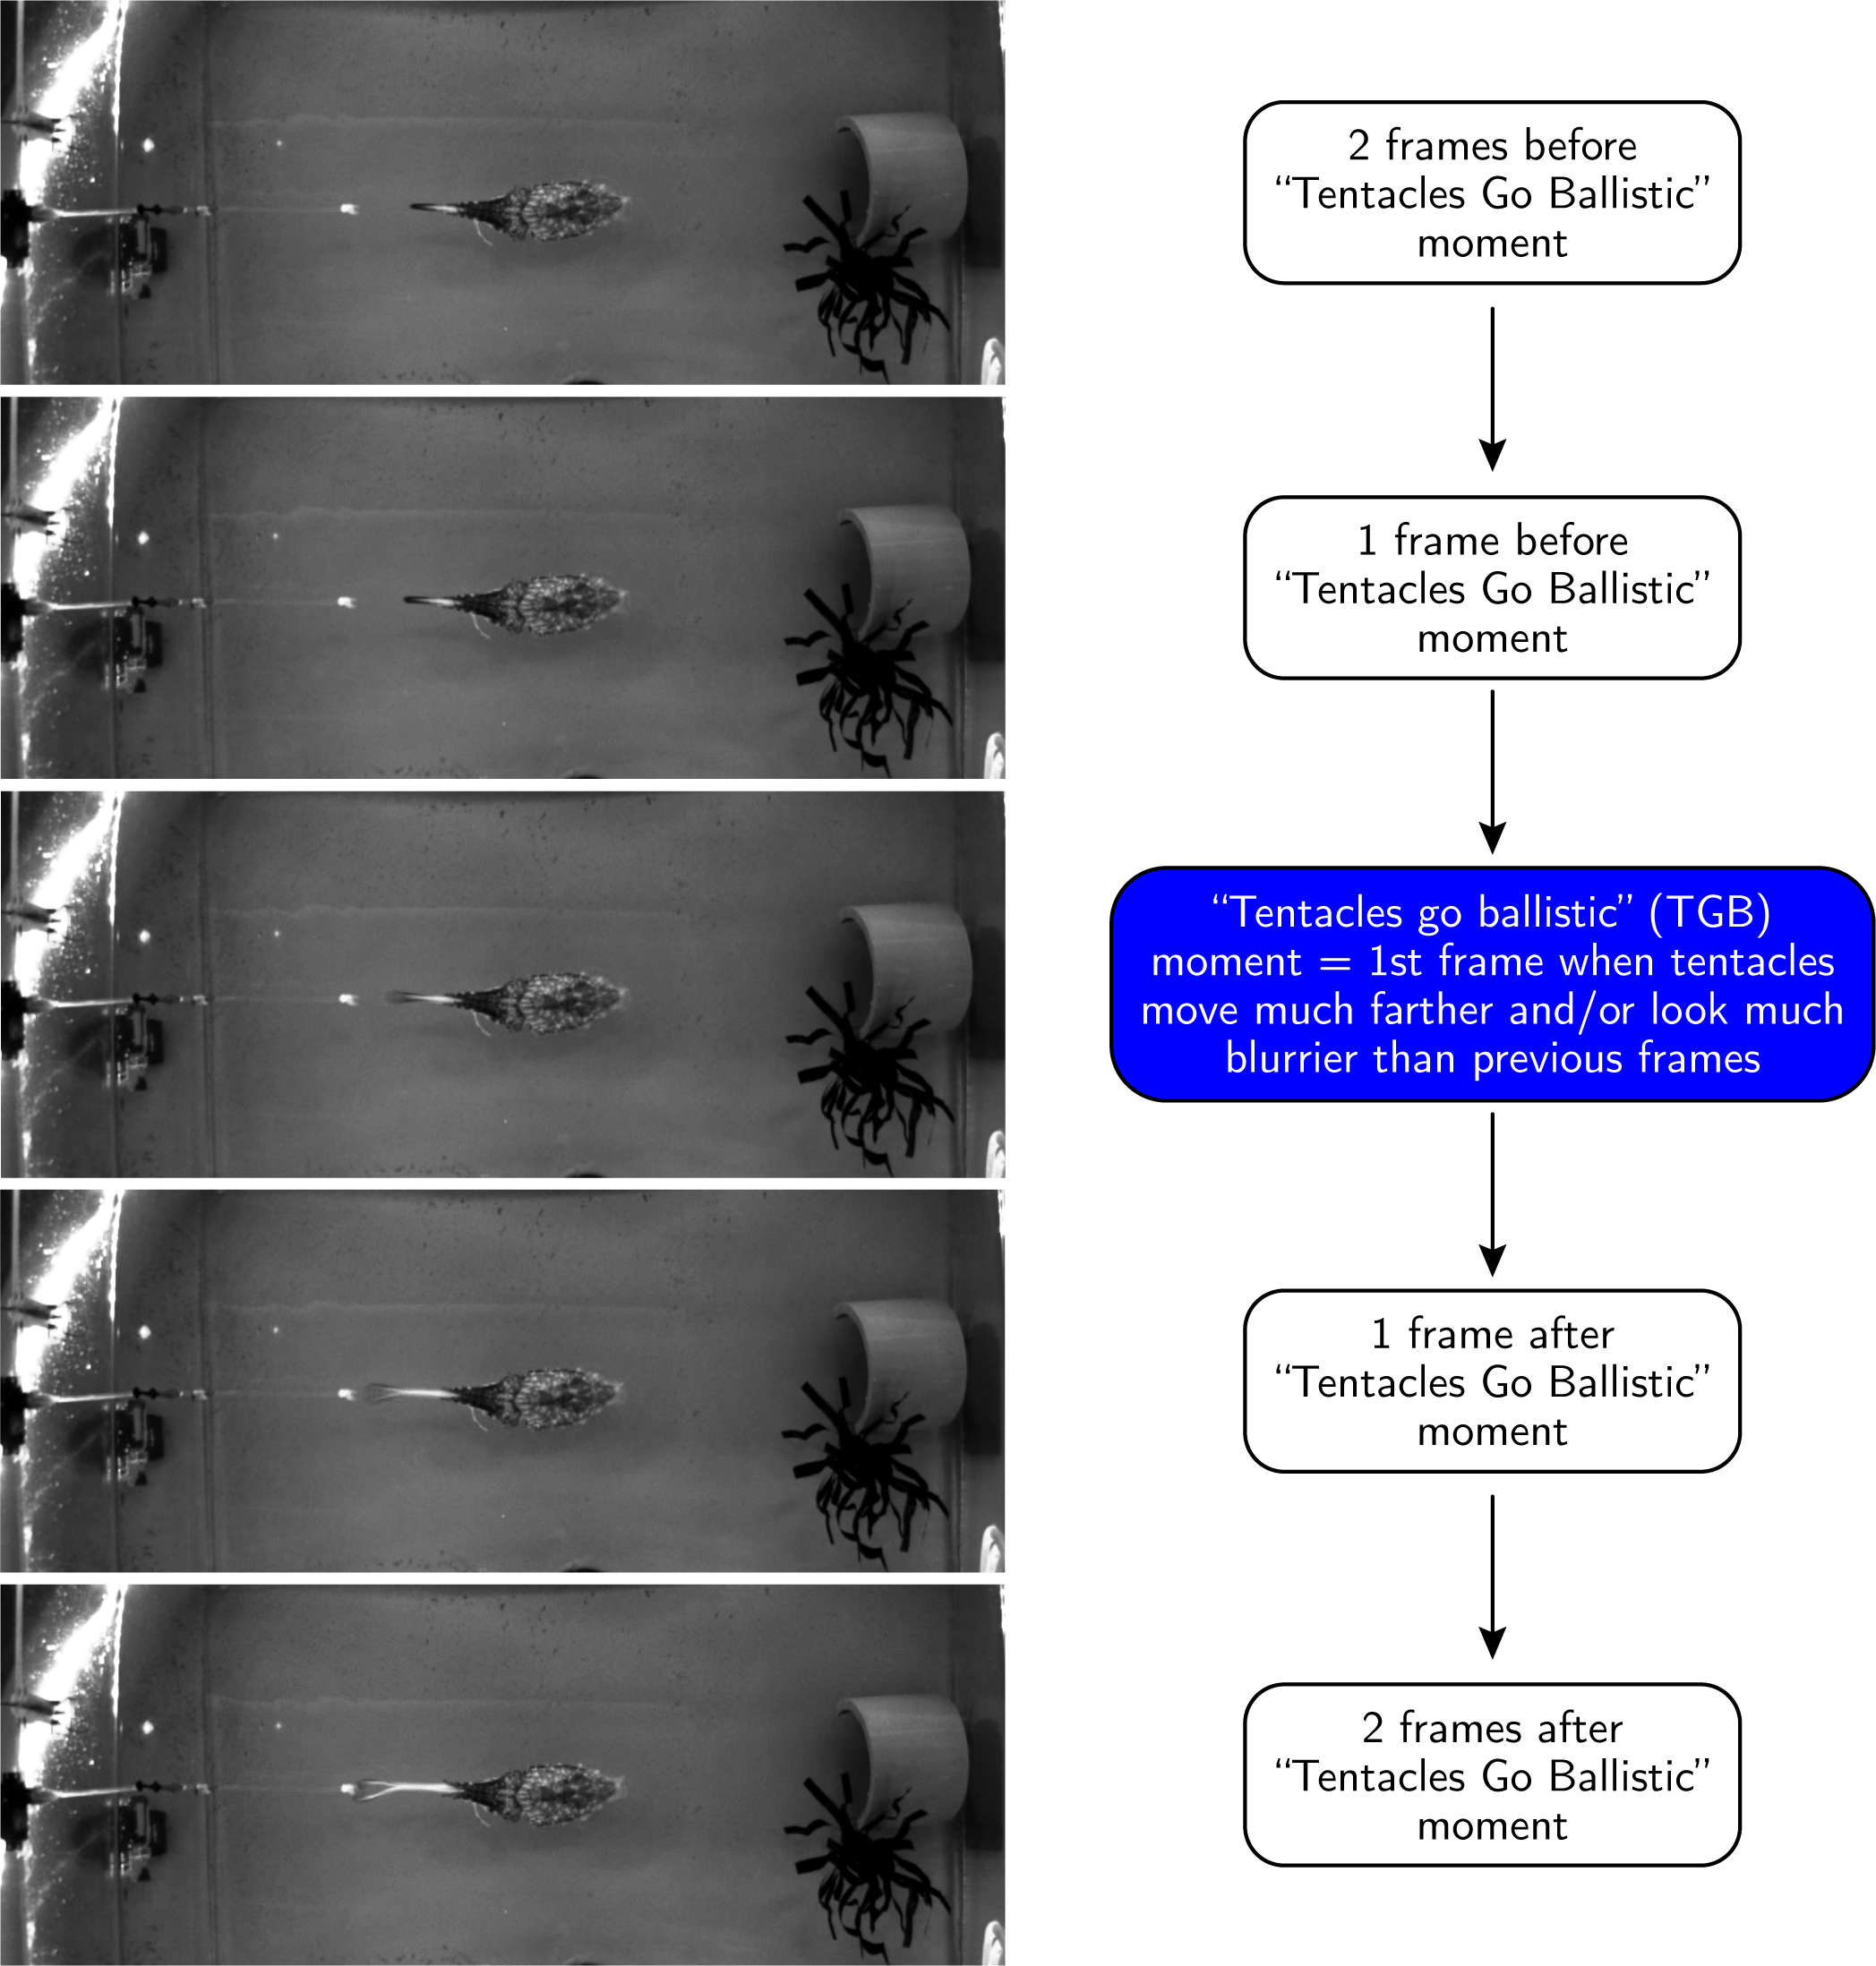
Figure S4: TGB Videos, temporal alignment. Example of how the TGB videos were aligned temporally on the frame in which ‘tentacles go ballistic’ (TGB).
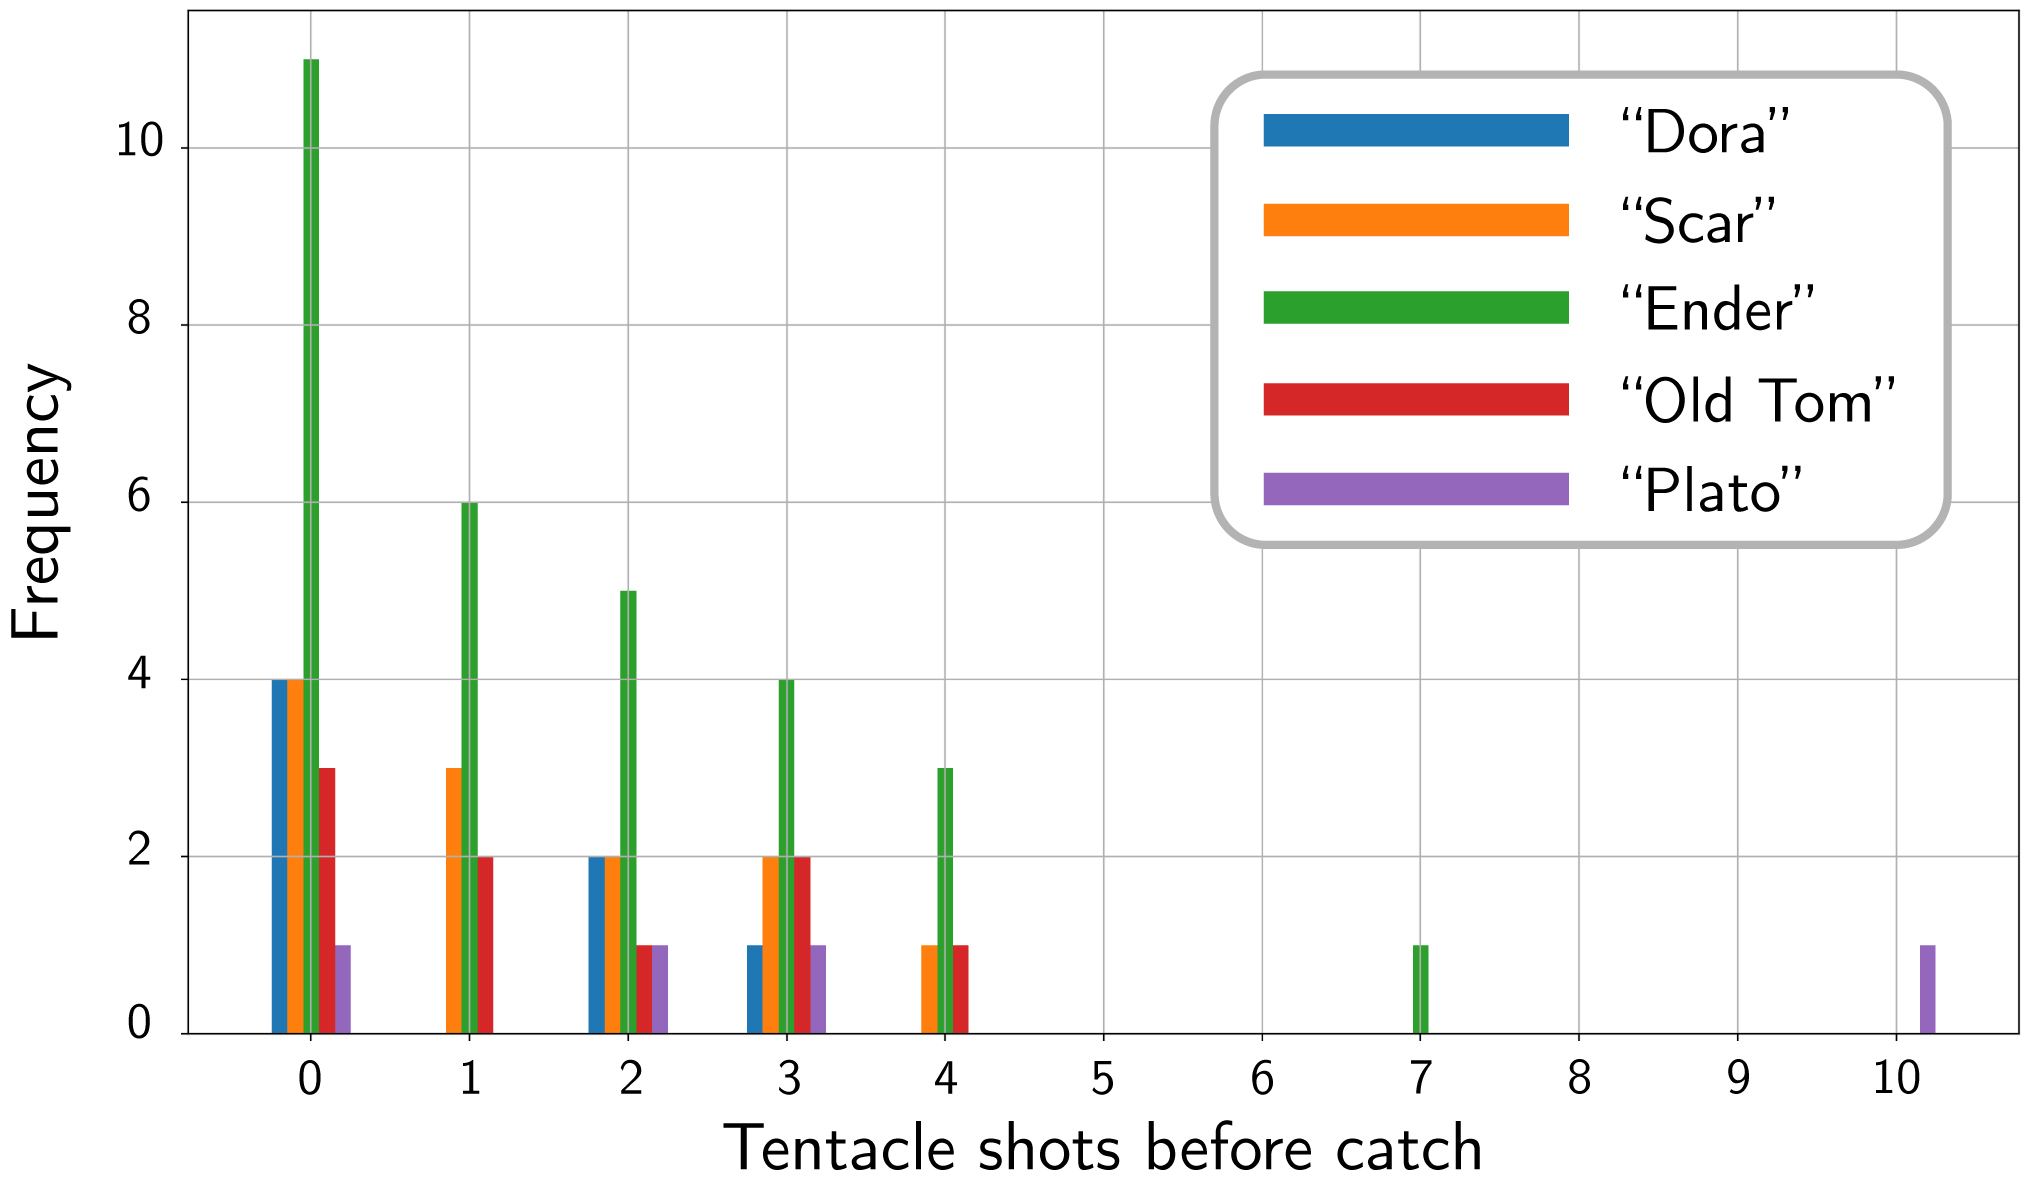
Figure S5: Number of tentacle shots before a catch for all animals. Summary plot showing the number of tentacle shots before a catch was successful; success frequency shown for all animals. Tentacle shots were annotated during data collection via Bonsai [15] and verified manually by re-watching overhead videos.
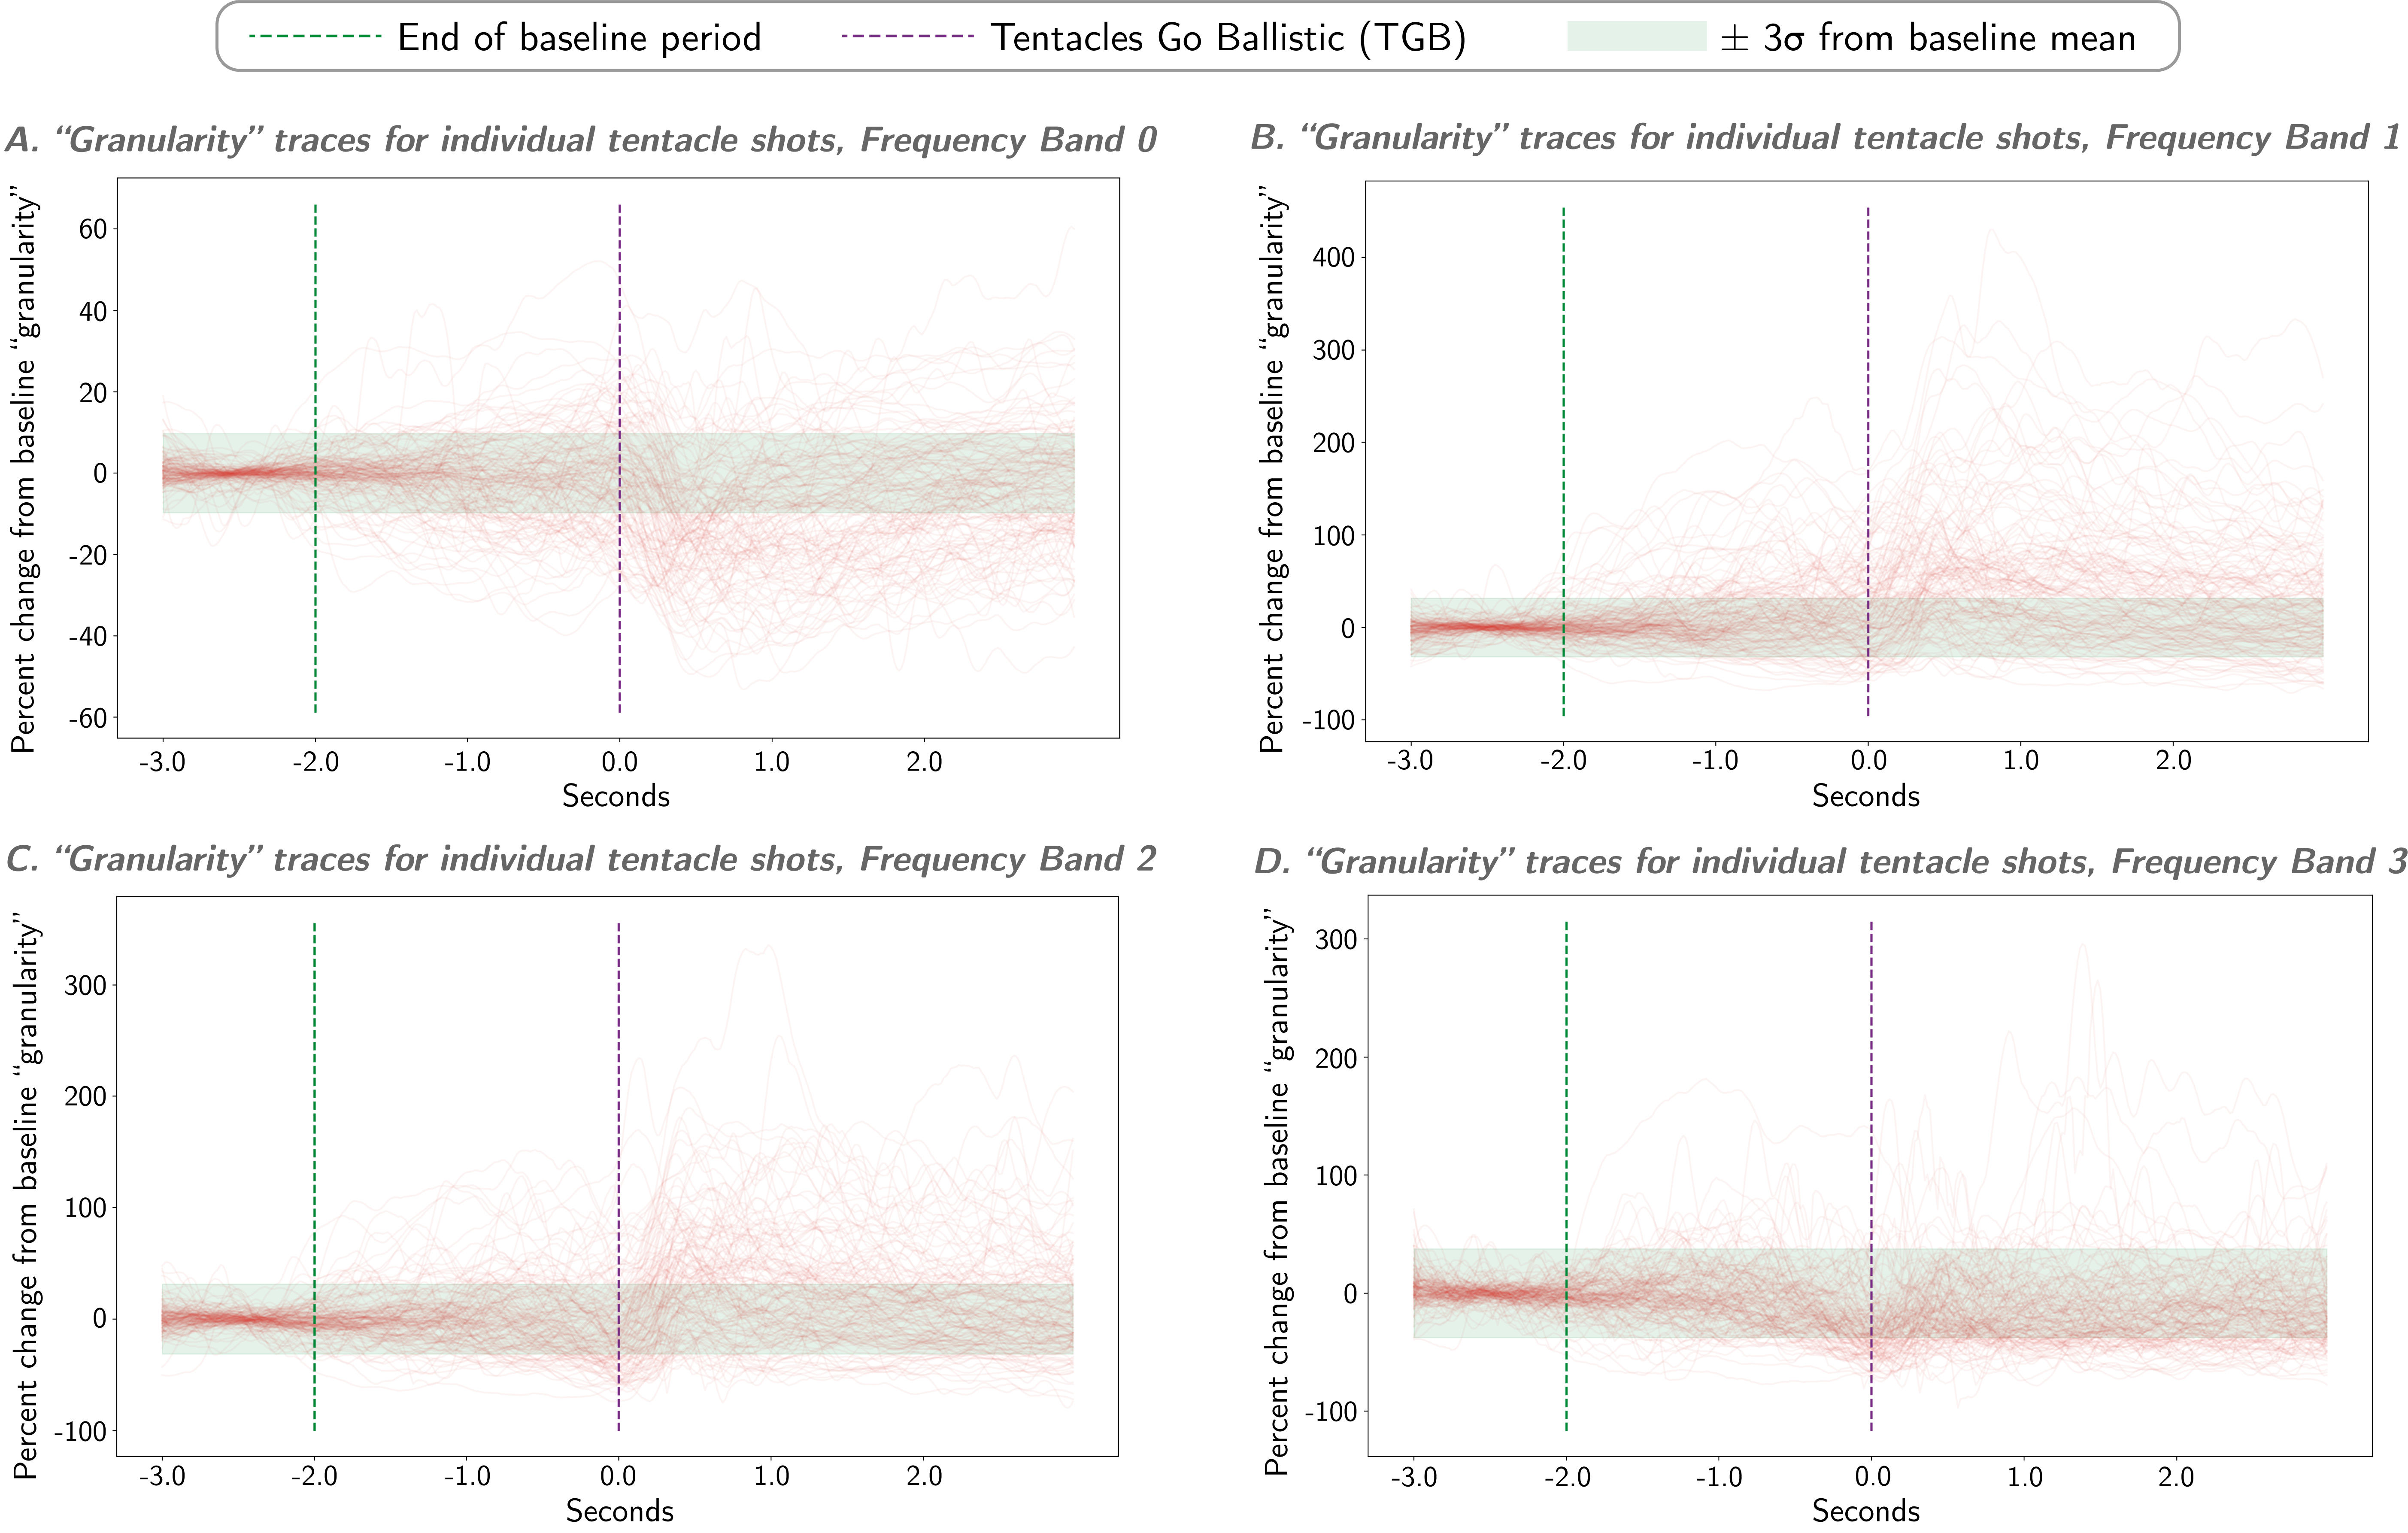
Figure S6: Descriptive plots showing ‘first exits’ from baseline mean ± 3σ. These plots visualize when the ‘granularity’ of the mantle pattern during individual tentacle shots deviated significantly (>3 standard deviations) from the mean of the baseline period (as measured by Process Cuttle Python, modified from [21]).
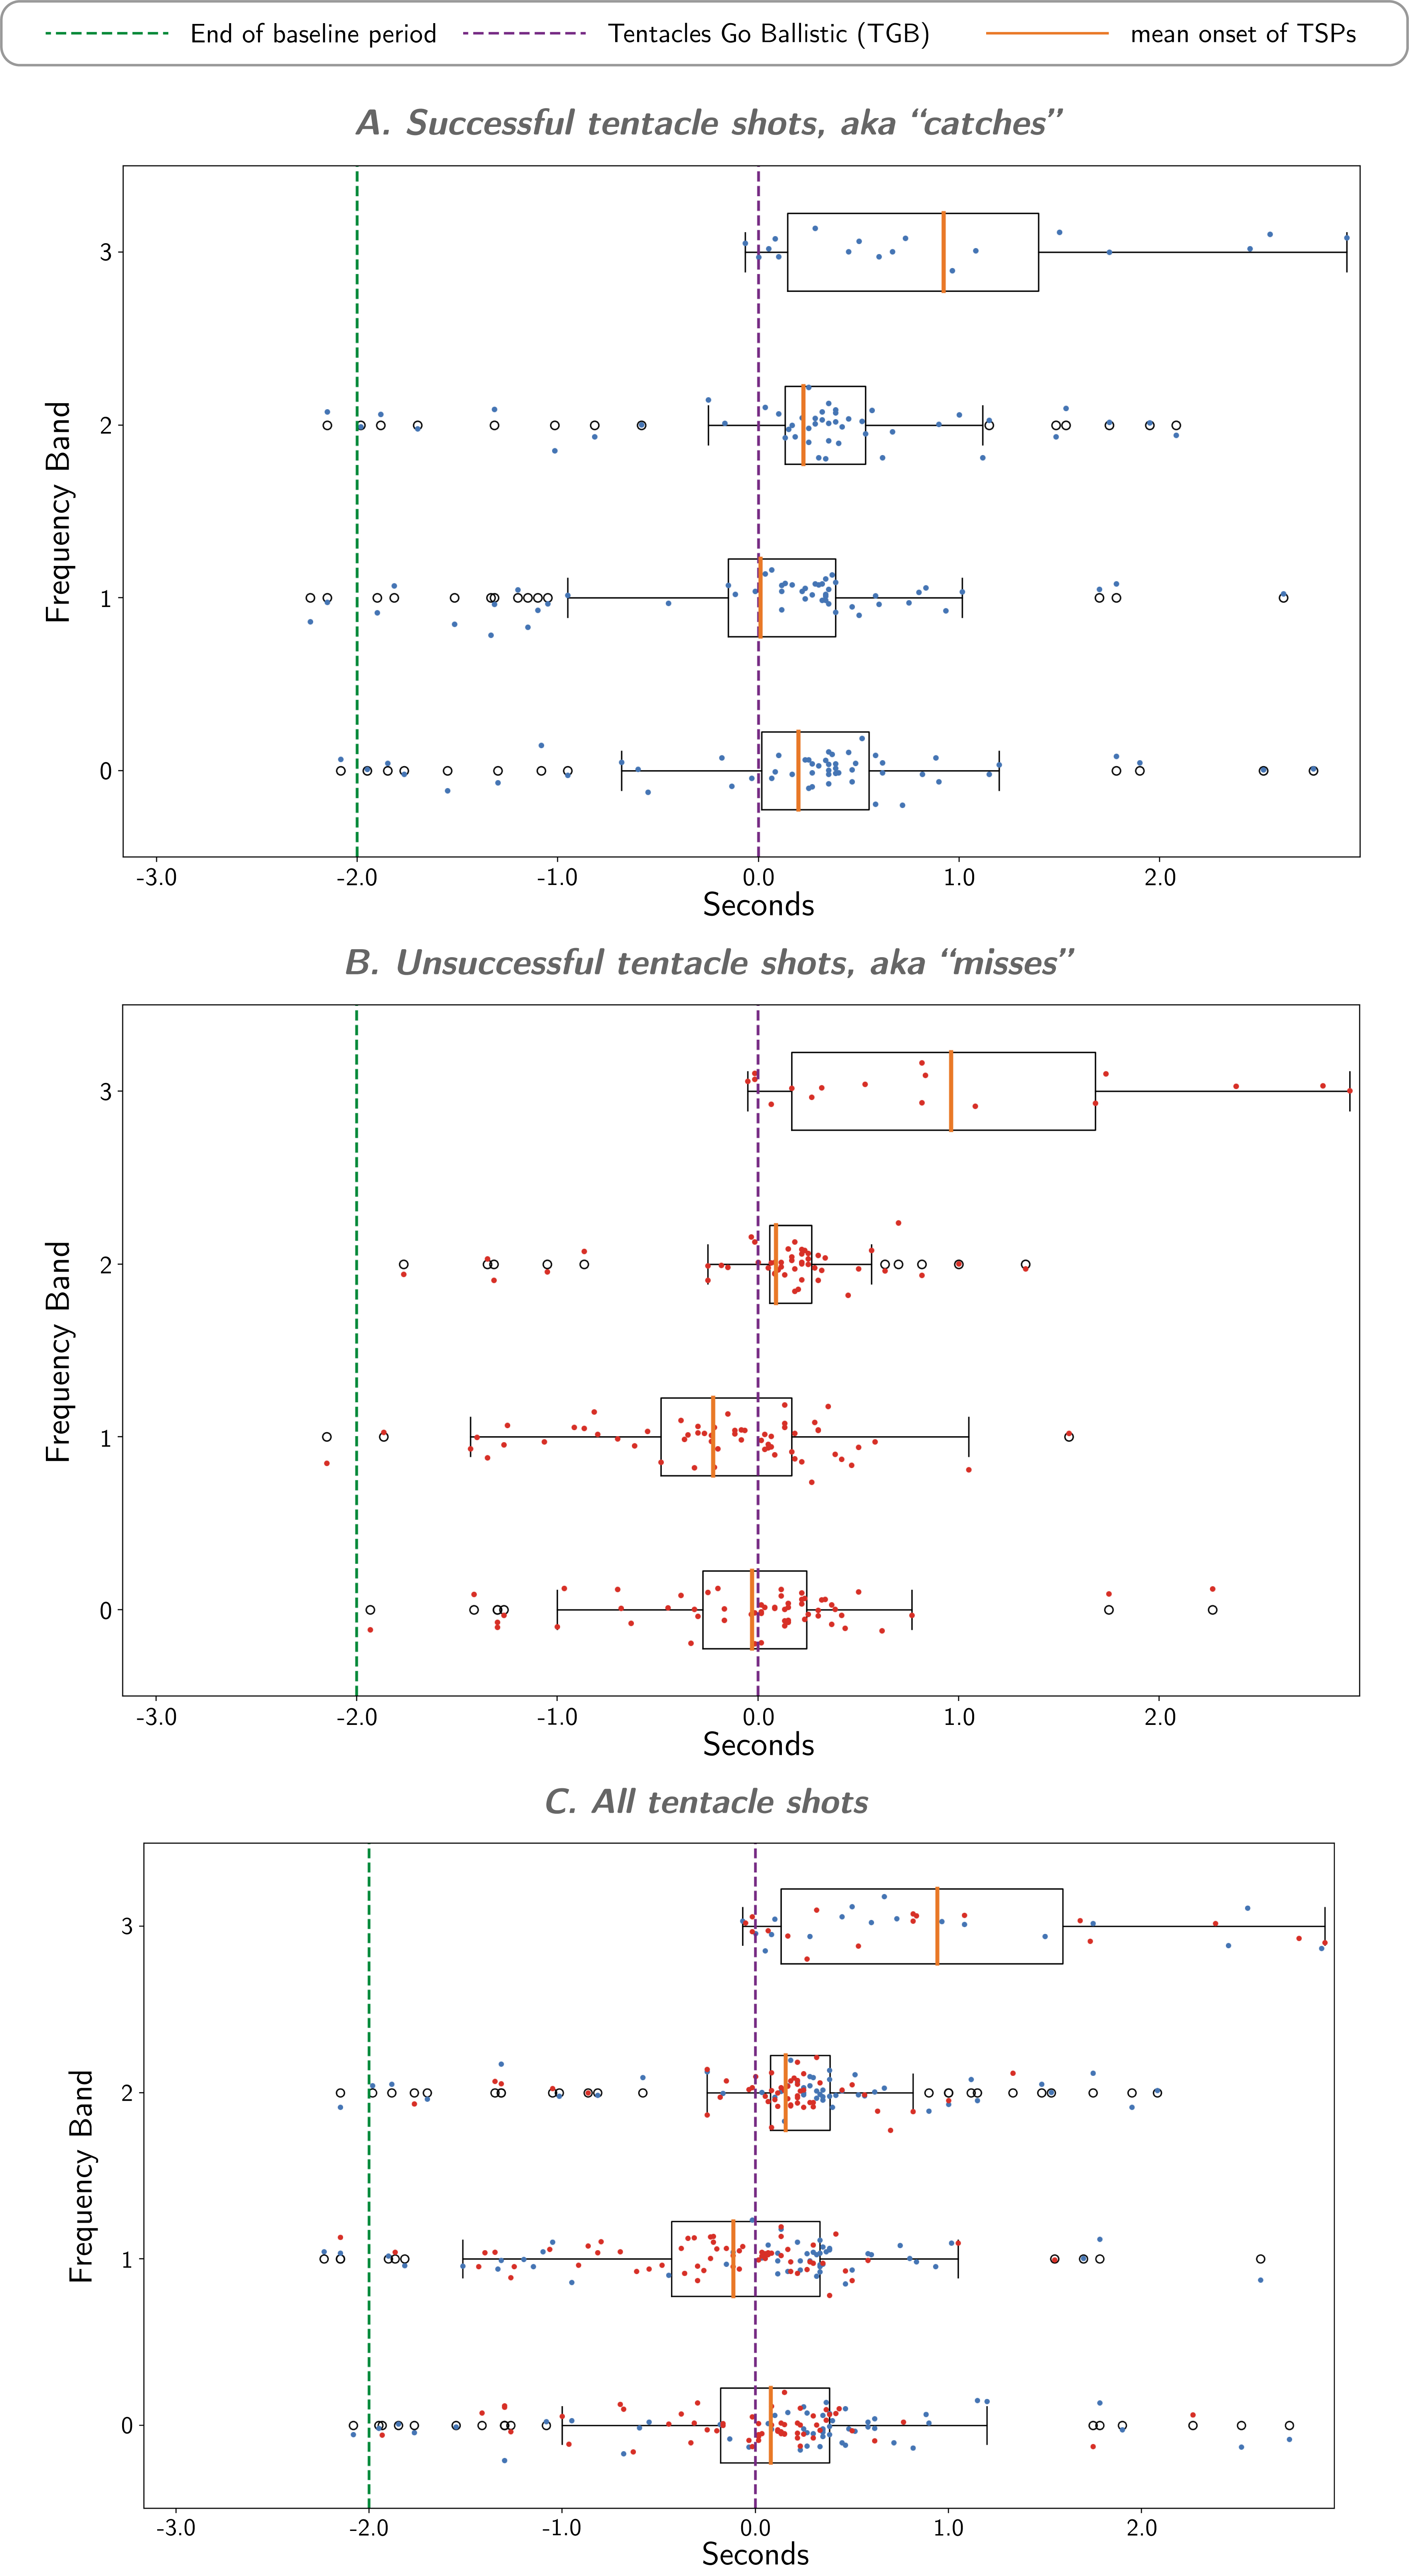
Figure S7: Boxplots showing distribution and mean onset of TSPs. Visualization of data from Table 2.
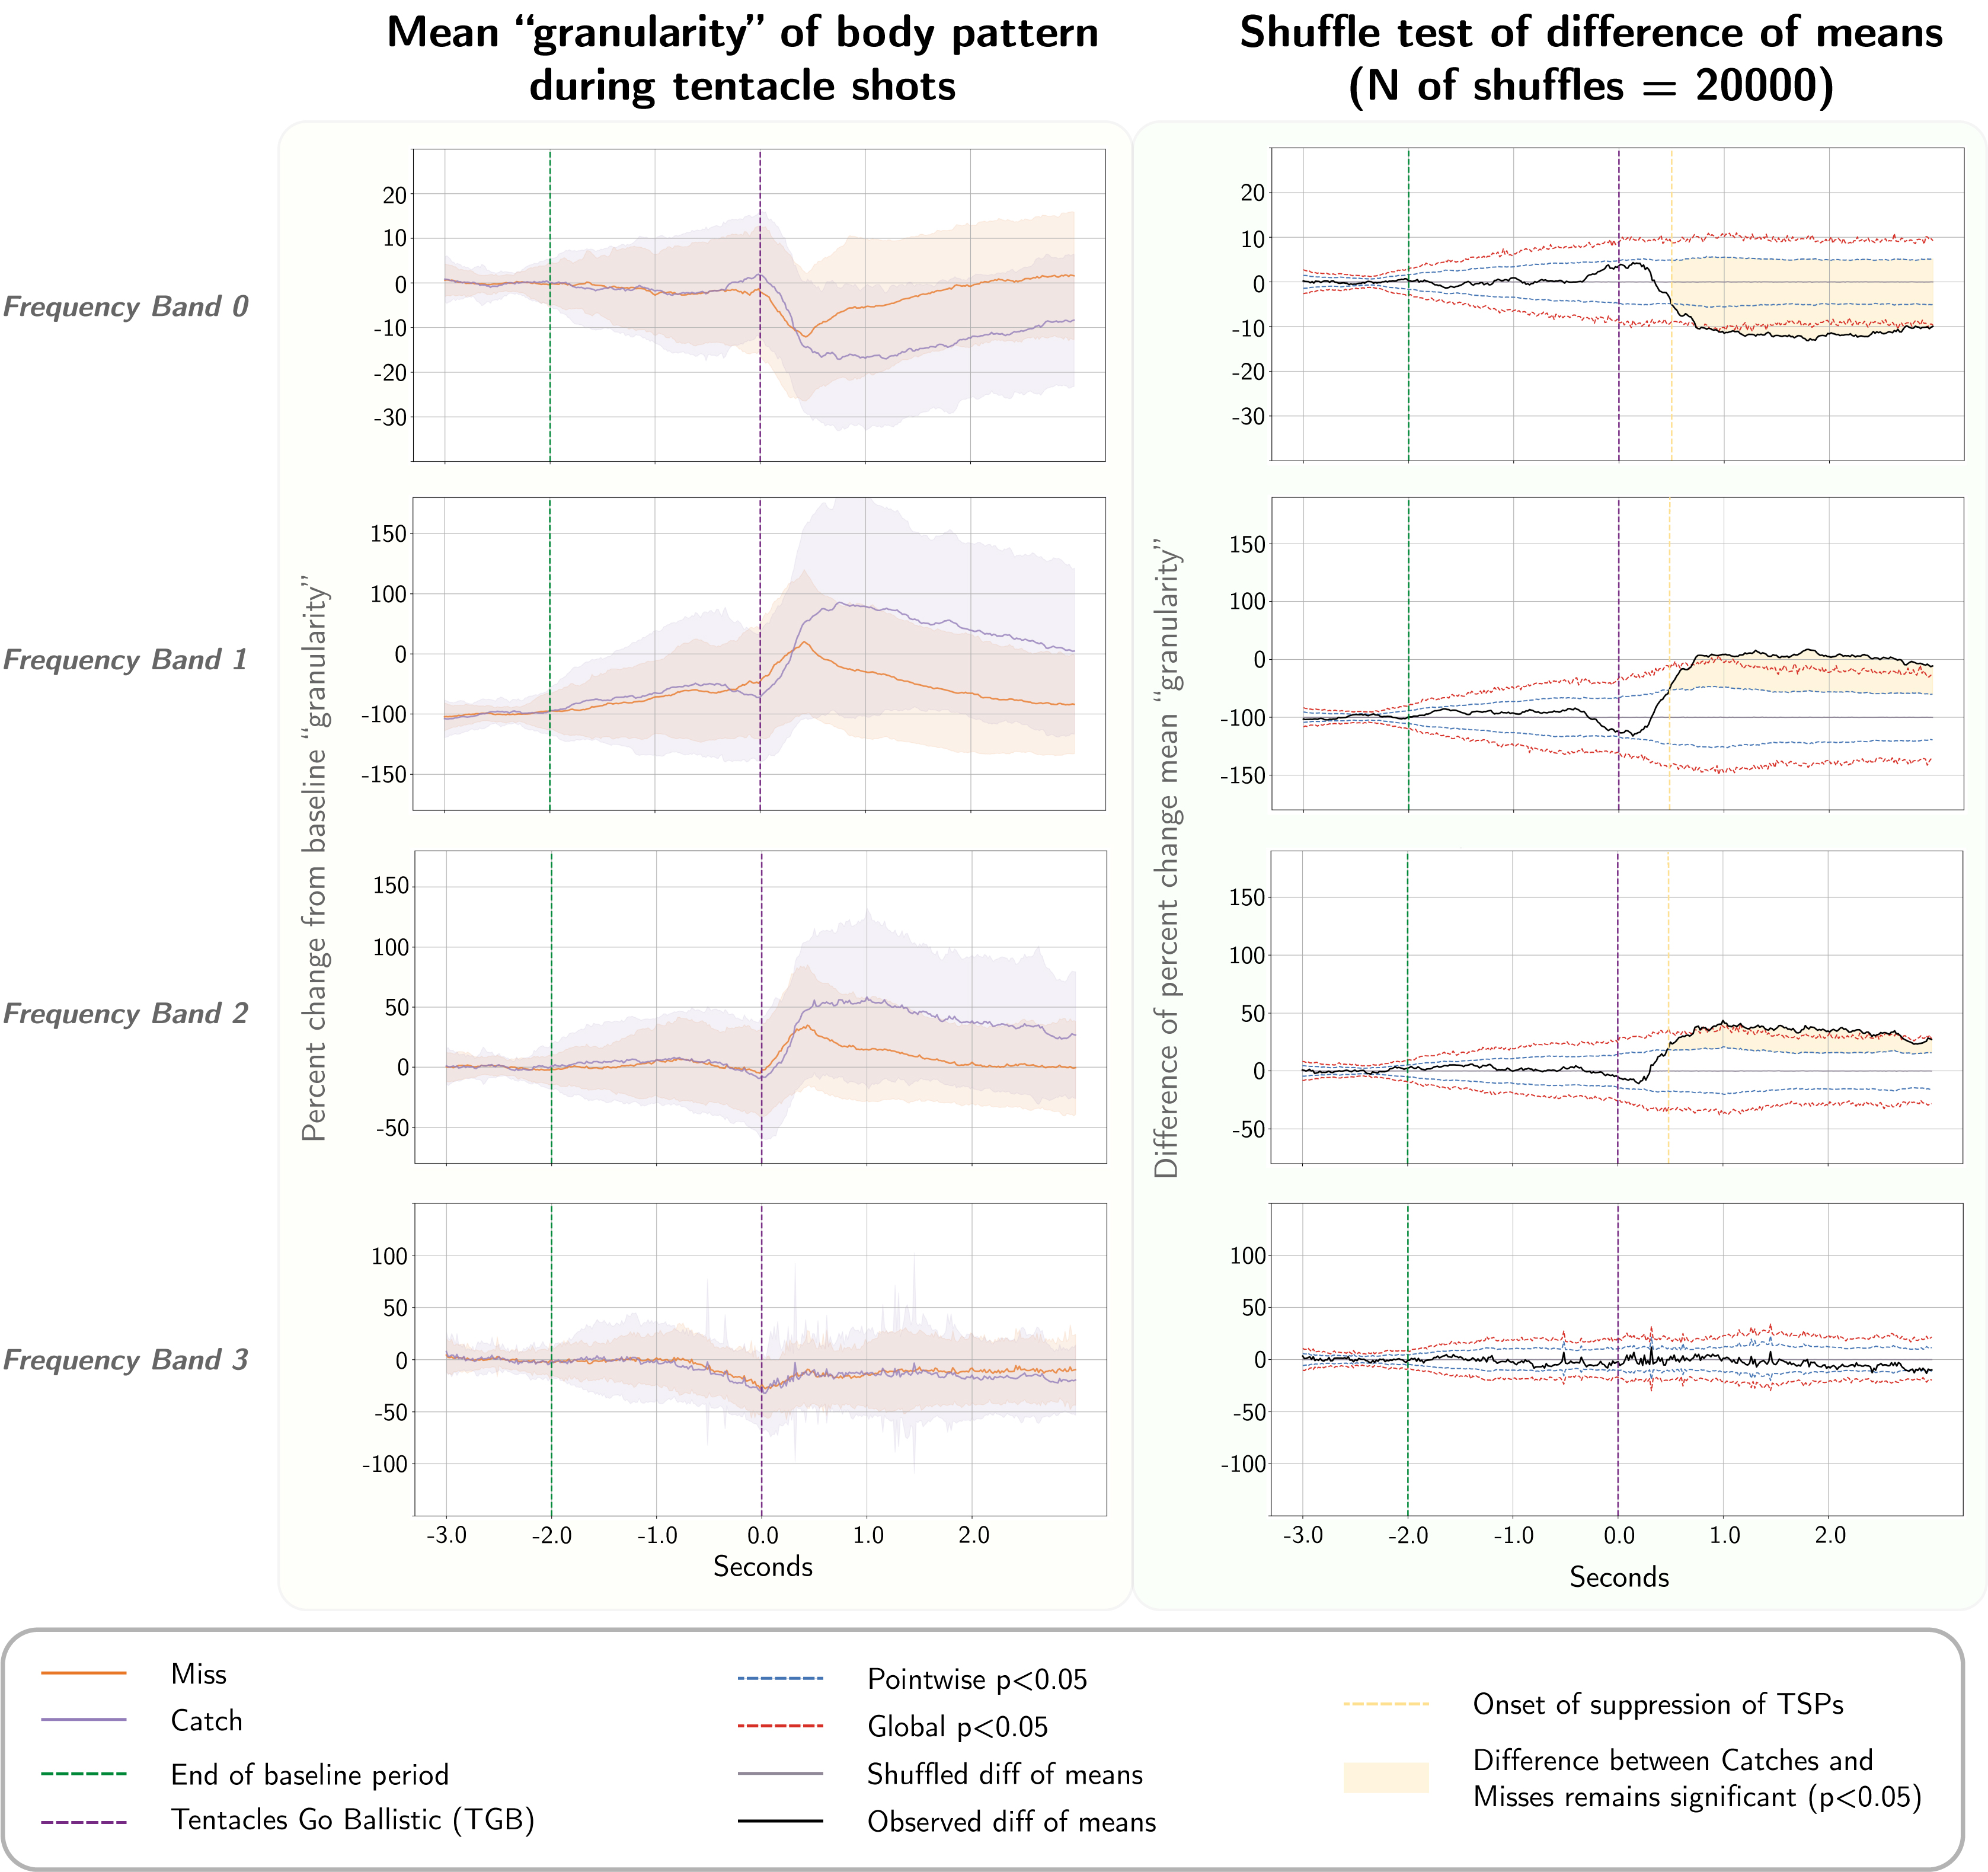
Figure S8: Quantifying dynamics of TSPs with ‘granularity’ analysis, all frequency bands. The left column shows the changes in mean ‘granularity’ of body pattern during tentacle shots (measured by Process Cuttle Python, modified from [21], in 4 different spatial frequency bands), from 3 seconds before TGB to 3 seconds after TGB, normalized and pooled across all subjects. The right column shows shuffle tests (N=20,000 shuffles) of the difference of means (catch vs. miss) in each frequency band, and a vertical dashed yellow line indicates when the difference becomes significant (p<0.05).
Experimental Protocol
Read the full experimental protocol.
Datasets
The full dataset for this experiment, including all videos from the overhead view monochrome camera and annotations, is shared online via the Harvard Dataverse and can be accessed here.
A low resolution version of the video dataset can be found online here:
Analysis Code Repository
All code used to analyze this dataset can be found here.
Leave a Comment